Environmental Data
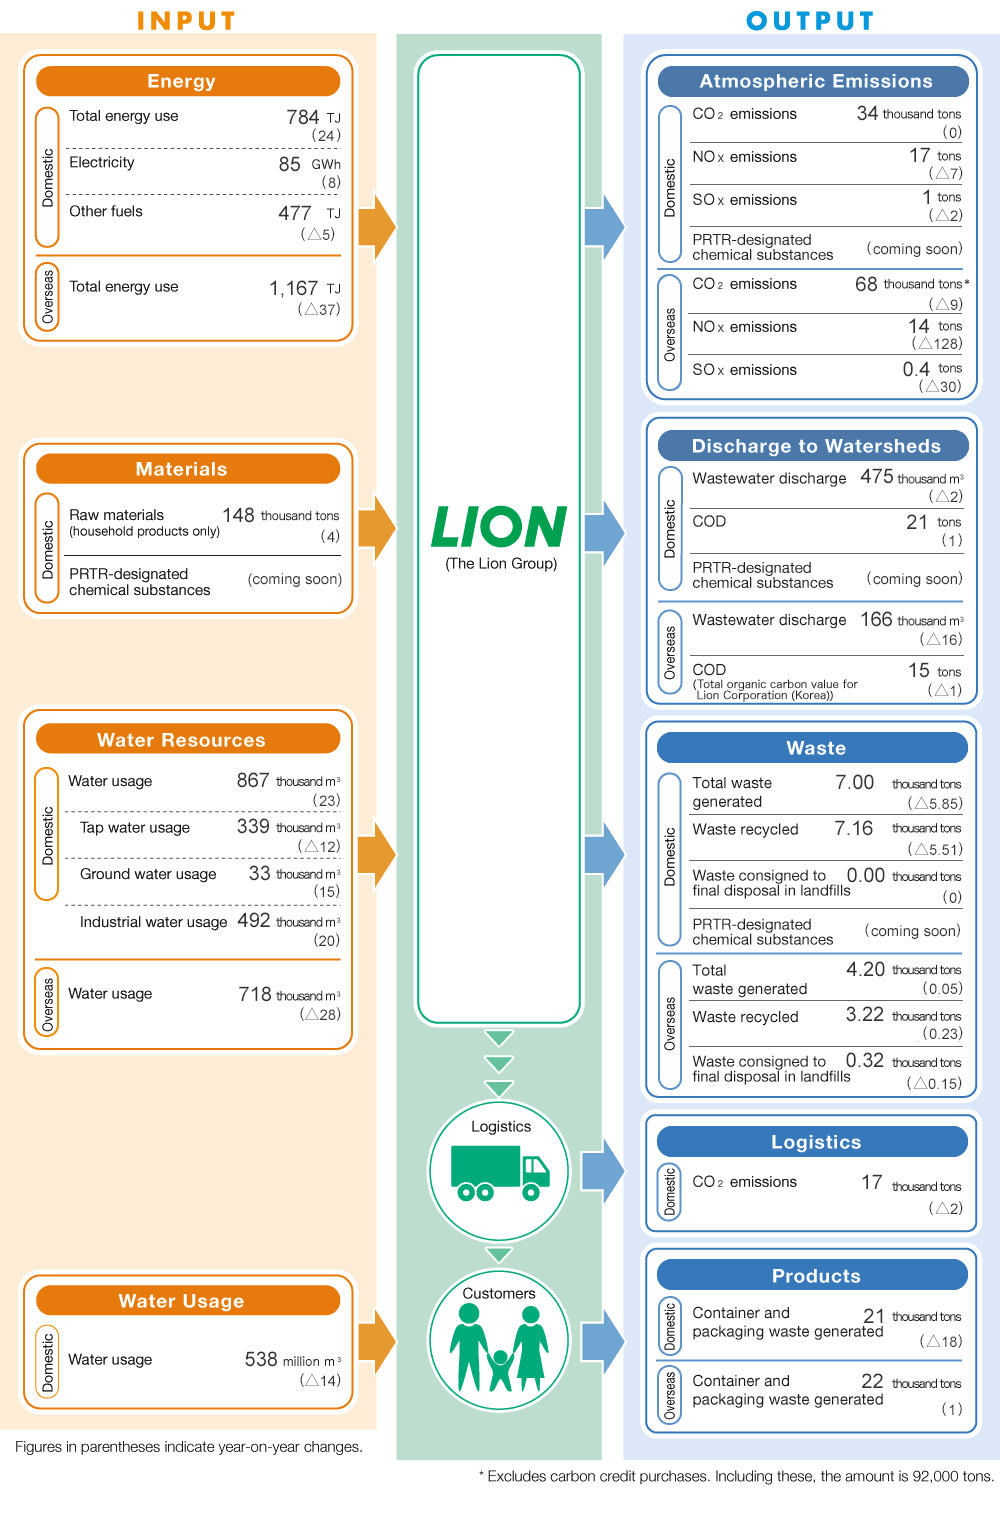
Overview of Environmental Burden Created by Business Activities
[Scope of Data] Lion and domestic and overseas consolidated subsidiaries
[Period Covered] January 2025 to December 2025: However, data for PRTR-designated chemical substances is for April 2025 to March 2026
Greenhouse Gass(CO2), Energy
CO2 Emissions and Reduction Rates at Operating Sites (Scope 1 and 2)
【Unit】Thousand t-CO2e、%
|
2017*1 |
2022 |
2023 |
2024 |
2025 |
| Scope 1 + 2 total emissions |
Domestic |
77 |
73 |
35 |
34 |
34 |
| Overseas |
89 |
70*2 |
66*2 |
77*2 |
72*2 |
| Domestic and overseas total |
166 |
143*3 |
101*3 |
111*3 |
106*3 |
| Scope 1 + 2 total emissions Reduction from 2017 |
Domestic |
— |
5 |
54 |
56 |
56 |
| Overseas |
— |
21 |
26 |
14 |
19 |
| Domestic and overseas total |
— |
14 |
39 |
33 |
36 |
*1
Base year
*2
Excludes carbon credit purchases. Including these, the amount was 85,000 tons in 2022, 82,000 tons in 2023 and 92,000 tons in 2024 and 87,000 tons in 2025
*3
Excludes carbon credit purchases. Including these, 159,000 tons in 2022, a 4% reduction, 117,000 tons in 2023, a 29% reduction and 126,000 tons in 2024, a 24% reduction and 121,000 tons in 2025, a 27% reduction.
More about related initiatives
CO2Emissions from Operating Sites (Scope 1 and 2, Location Basis, Market Basis)
【Unit】Thousand t-CO2e
|
2017* |
2022 |
2023 |
2024 |
2025 |
| Scope 1 |
Domestic |
22 |
21 |
20 |
19 |
19 |
| Overseas |
45 |
49 |
43 |
54 |
52 |
| Domestic and overseas total |
67 |
70 |
63 |
73 |
71 |
| Scope 2 (location basis) |
Domestic |
55 |
52 |
50 |
49 |
52 |
| Overseas |
43 |
38 |
41 |
42 |
40 |
| Domestic and overseas total |
98 |
90 |
90 |
91 |
93 |
| Scope 2 (market basis) |
Domestic |
55 |
52 |
15 |
15 |
15 |
| Overseas |
43 |
36 |
38 |
38 |
35 |
| Domestic and overseas total |
98 |
89 |
54 |
54 |
50 |
| Amount of carbon credits purchased |
Domestic |
0 |
0 |
0 |
0 |
0 |
| Overseas |
0 |
16 |
16 |
16 |
15 |
| Domestic and overseas total |
0 |
16 |
16 |
16 |
15 |
*
Base year
Breakdown of Greenhouse CO2 Emissions (Scope 1, 2 and 3) Throughout the Supply Chain
【Domestic/Overseas】
【Unit】%,Thousand t-CO2e
|
2017* |
2022 |
2023 |
2024 |
2025 |
| Scope 1 |
1.5 |
1.4 |
1.3 |
1.5 |
1.7 |
| Scope 2 |
2.1 |
1.4 |
1.1 |
1.1 |
1.2 |
| Scope 3 |
Purchased goods and services |
21.8 |
24.8 |
25.9 |
28.7 |
29.1 |
| Capital goods |
0.8 |
1.2 |
1.4 |
0.8 |
0.7 |
| Fuel- and energy-related activities not included in Scope 1 or Scope 2 |
0.4 |
0.6 |
0.6 |
0.7 |
0.8 |
| Upstream transportation and distribution |
3.4 |
4.2 |
2.6 |
2.8 |
3.0 |
| Waste generated in operations |
0.1 |
0.1 |
0.1 |
0.2 |
0.1 |
| Business travel |
0.1 |
0.0 |
0.0 |
0.0 |
0.0 |
| Employee commuting |
0.1 |
0.0 |
0.1 |
0.1 |
0.1 |
| Downstream transportation and distribution |
0.1 |
0.2 |
0.1 |
0.2 |
0.2 |
| Processing of sold products |
5.3 |
2.1 |
2.3 |
2.1 |
0.8 |
| Use of sold products |
54.3 |
53.2 |
51.2 |
49.0 |
47.9 |
| End-of-life treatment of sold products |
9.6 |
10.3 |
12.8 |
12.4 |
13.9 |
| Investments |
0.4 |
0.5 |
0.5 |
0.4 |
0.5 |
| Total |
461 |
527 |
489 |
486 |
419 |
*
Base year
More about related initiatives
Total Energy Consumption by Operating Sites
【Unit】TJ
|
2022 |
2023 |
2024 |
2025 |
| Total Energy Consumption |
Domestic |
839 |
810 |
760 |
784 |
| Overseas |
1,143 |
1,053 |
1,204 |
1,167 |
| Domestic and overseas total |
1,982 |
1,862 |
1,965 |
1,951 |
More about related initiatives
Total Renewable and Non-Renewable Energy Consumption by Operating Sites
【Unit】GWh,%
|
2022 |
2023 |
2024 |
2025 |
| Total non-renewable energy consumption |
Domestic |
0.45 |
80 |
77 |
85 |
| Overseas |
1 |
1 |
3 |
4 |
| Domestic and overseas total |
1.8 |
81 |
79 |
89 |
| Total renewable energy consumption |
Domestic |
232 |
145 |
134 |
133 |
| Overseas |
316 |
291 |
332 |
320 |
| Domestic and overseas total |
549 |
436 |
466 |
453 |
| Total renewable energy consumption/ total energy consumption |
Domestic and overseas total |
0.33 |
15.7 |
14.6 |
16.5 |
CO2 emissions throughout product life cycles
【Domestic/Overseas】
【Unit】Thousand t-CO2e
|
2022 |
2023 |
2024 |
2025 |
| CO2 emissions throughout product life cycles |
4,780 |
4,427 |
4,164 |
3,786 |
Breakdown of CO2 Emissions over the Life Cycles of Lion Products
【Domestic/Overseas】
【Unit】%
|
2022 |
2023 |
2024 |
2025 |
| Raw material procurement |
25 |
26 |
27 |
29 |
| Production |
3 |
3 |
3 |
3 |
| Transport |
4 |
3 |
3 |
3 |
| Use by consumers |
57 |
55 |
54 |
50 |
| Disposal by consumers |
11 |
13 |
13 |
15 |
More about related initiatives
Water
Water Usage (Water Withdrawal) by Operating Sites
【Unit】Thousand m3
|
2022 |
2023 |
2024 |
2025 |
| Water Usage (Water Withdrawal) |
Domestic |
940 |
932 |
844 |
867 |
| Overseas |
683 |
716 |
746 |
718 |
| Domestic and overseas total |
1,623 |
1,647 |
1,590 |
1,584 |
More about related initiatives
Water Usage (Water Withdrawal) by Source
【Unit】Thousand m3
|
2022 |
2023 |
2024 |
2025 |
| Tap water |
Domestic |
365 |
388 |
351 |
339 |
| Overseas |
655 |
482 |
413 |
340 |
| Domestic and overseas total |
1,020 |
870 |
764 |
679 |
| Industrial water |
Domestic |
529 |
518 |
472 |
492 |
| Overseas |
28 |
233 |
333 |
365 |
| Domestic and overseas total |
557 |
752 |
805 |
857 |
| Groundwater |
Domestic |
44 |
24 |
18 |
33 |
| Overseas |
0 |
0 |
0 |
13 |
| Domestic and overseas total |
44 |
24 |
18 |
47 |
| Rainwater |
Domestic |
2 |
2 |
2 |
0 |
| Overseas |
0 |
0 |
0 |
0 |
| Domestic and overseas total |
2 |
2 |
2 |
0 |
Wastewater Discharge at Operating Sites
【Unit】Thousand m3
|
2022 |
2023 |
2024 |
2025 |
| Wastewater Discharge |
Domestic |
512 |
493 |
477 |
475 |
| Overseas |
180 |
189 |
182 |
166 |
| Domestic and overseas total |
692 |
682 |
659 |
641 |
Wastewater Discharge by Destination at Operating Sites
【Unit】Thousand m3
|
2022 |
2023 |
2024 |
2025 |
| Sewage systems |
Domestic |
322 |
302 |
276 |
280 |
| Overseas |
74 |
85 |
85 |
75 |
| Domestic and overseas total |
396 |
387 |
361 |
356 |
| Sea area |
Domestic |
130 |
135 |
154 |
146 |
| Overseas |
0 |
0 |
0 |
0 |
| Domestic and overseas total |
130 |
135 |
154 |
146 |
| Rivers |
Domestic |
60 |
56 |
46 |
49 |
| Overseas |
5 |
6 |
8 |
12 |
| Domestic and overseas total |
65 |
62 |
54 |
62 |
| Other (industrial park treatment facilities) |
Domestic |
0 |
0 |
0 |
0 |
| Overseas |
101 |
99 |
89 |
78 |
| Domestic and overseas total |
101 |
99 |
89 |
78 |
Water Use over the Life Cycles of Lion Products
【Domestic/Overseas】
【Unit】Million m3,Thousand m3/million yen,%
|
2022 |
2023 |
2024 |
2025 |
| Water Usage |
2,303 |
2,228 |
2,057 |
2,039 |
| Usage intensity per unit net sales |
5.91 |
5.53 |
4.98 |
4.83 |
| Decrease in usage intensity per unit net sales from 2017 |
7 |
13 |
22 |
24 |
Breakdown of Water Use over the Life Cycles of Lion Products
【Domestic/Overseas】
【Unit】%
|
2022 |
2023 |
2024 |
2025 |
| Raw material procurement |
19.8 |
21.0 |
20.1 |
20.1 |
| Production |
0.1 |
0.1 |
0.1 |
0.1 |
| Transport |
0.0 |
0.0 |
0.0 |
0 |
| Use by consumers |
75.8 |
74.0 |
74.9 |
75.2 |
| Disposal by consumers |
4.3 |
4.9 |
4.9 |
4.7 |
More about related initiatives
Container and Packaging Material Usage / Waste
Container and Packaging Material Usage by Material Type
【Unit】Thousand tons
|
2022 |
2023 |
2024 |
2025 |
| Container and Packaging Material Usage* |
Domestic |
56 |
55 |
48 |
41 |
| Overseas |
49 |
51 |
53 |
55 |
| Domestic and overseas total |
105 |
106 |
101 |
97 |
*
Usage amounts of plastics, cardboard, paperboard, glass, and metal for household products
Container and Packaging Material Usage* by Material Type
【Unit】Thousand tons
|
2022 |
2023 |
2024 |
2025 |
| Plastic |
Domestic |
18 |
18 |
16 |
15 |
| Overseas |
18 |
18 |
19 |
19 |
| Domestic and overseas total |
36 |
36 |
35 |
34 |
| Corrugated cardboard |
Domestic |
27 |
27 |
24 |
22 |
| Overseas |
29 |
30 |
32 |
33 |
| Domestic and overseas total |
56 |
57 |
56 |
55 |
| Cardboard |
Domestic |
5 |
5 |
4 |
3 |
| Overseas |
2 |
2 |
3 |
3 |
| Domestic and overseas total |
7 |
7 |
7 |
7 |
| Glass |
Domestic |
6 |
6 |
3 |
0 |
| Overseas |
0 |
0 |
0 |
0.1 |
| Domestic and overseas total |
6 |
6 |
3 |
0.1 |
| Metals |
Domestic |
0.1 |
0.1 |
0.1 |
0 |
| Overseas |
0 |
0 |
0 |
0.1 |
| Domestic and overseas total |
0.1 |
0.1 |
0.1 |
0.1 |
*
Usage amounts for household products
More about related initiatives
Total Waste Generation, Total Waste Consigned to Final Disposal in Landfills and Total Resources Recovered
【Unit】Thousand tons
|
2022 |
2023 |
2024 |
2025 |
| Total Waste Generation |
Domestic |
11.22 |
8.77 |
12.85 |
7.16 |
| Overseas |
4.19 |
4.26 |
4.15 |
4.2 |
| Domestic and overseas total |
15.41 |
13.03 |
17.00 |
11.36 |
| Total Waste Consigned to Final Disposal in Landfills |
Domestic |
0.00 |
0.00 |
0.00 |
0 |
| Overseas |
0.38 |
0.50 |
0.47 |
0.32 |
| Domestic and overseas total |
0.38 |
0.50 |
0.47 |
0.33 |
| Total Resources Recovered |
Domestic |
3.22 |
3.02 |
3.02 |
2.61 |
| Overseas |
3.15 |
3.11 |
3.13 |
3.11 |
| Domestic and overseas total |
6.37 |
6.13 |
6.13 |
5.72 |
More about related initiatives
【Domestic/Overseas】
【Unit】Thousand tons
|
2022 |
2023 |
2024 |
2025 |
| Recycled or reused |
17.56 |
13.86 |
17.65 |
12.8 |
| Landfill |
0.38 |
0.50 |
0.47 |
0.32 |
Incinerated
(with energy recovery) |
3.20 |
3.86 |
4.14 |
3.13 |
Incinerated
(without energy recovery) |
0.44 |
0.76 |
0.69 |
0.76 |
| Disposal method unknown |
0.00 |
0.00 |
0.00 |
0.00 |
Industrial Waste Disposal Facility Maintenance and Management Data
Chiba Plant
*
As the sludge incineration plant was decommissioned in 2024, there have been no updates since June 2024.
Chemical Substances
PRTR-Designated Substance Emissions
【Domestic】
【Unit】Tons
|
2022 |
2023 |
2024 |
2025 |
| PRTR-Designated Substance Emissions |
2 |
3 |
9 |
coming soon |
PRTR-Designated Substance Emissions
VOC Emissions
【Domestic】
【Unit】Tons
|
2022 |
2023 |
2024 |
2025 |
| Volatile organic compound (VOC) emissions |
57 |
53 |
54 |
coming soon |
Emissions of Nitrogen Oxides (NOX), Sulfur Oxides (SOX) and Particulate Matter
【Unit】Tons
|
2022 |
2023 |
2024 |
2025 |
| Emissions of Nitrogen Oxides (NOX) |
Domestic |
26 |
25 |
24 |
17 |
| Overseas |
3 |
38 |
142 |
14 |
| Domestic and overseas total |
56 |
62 |
167 |
31 |
| Emissions of Sulfur Oxides (SOX) |
Domestic |
3 |
4 |
3 |
1 |
| Overseas |
3 |
1 |
30 |
0 |
| Domestic and overseas total |
6 |
5 |
33 |
1 |
| Particulate Matter |
Domestic |
1 |
0 |
0 |
0 |
| Overseas |
26 |
26 |
58 |
35 |
| Domestic and overseas total |
28 |
26 |
58 |
35 |
COD at Operating Sites
【Unit】Tons
|
2022 |
2023 |
2024 |
2025 |
| COD |
Domestic |
28 |
21 |
20 |
21 |
| Overseas |
18 |
15 |
16 |
15 |
| Domestic and overseas total |
47 |
36 |
36 |
37 |
*
Lion Corporation (Korea) COD is TOC
More about related initiatives
Environmental Accounting
Based on the Ministry of the Environment’s guidelines, every year we calculate and disclose the environmental conservation cost and the economic benefits (real effect) of environmental conservation measures for the entire domestic Lion Group.(January 2024 to December 2024)
Breaking down total environmental conservation cost in 2024, although investment (capital expenditure) increased approximately ¥17.6 billion and overall cost decreased approximately ¥2.8 billion.
*
We will publish the environmental accounting data for 2025 (January–December 2025) as soon as the compilation and verification processes have been completed.
Environmental Conservation Cost
(Millions of yen)
| Category |
Category |
January 2024 to December 2024 |
| Investment |
Cost |
| Business area cost |
Pollution prevention |
128 |
202 |
| Global environmental conservation |
879 |
3,547 |
| Resource recycling |
36 |
406 |
| Environmentally friendly products |
3,037 |
3,062 |
| Upstream/downstream cost |
Container/packaging recycling |
— |
757 |
| Administration cost |
ISO 14001 registration, environmental education |
0 |
629 |
| R&D cost |
R&D of environmentally friendly products, etc. |
75 |
920 |
| Social activity cost |
Environmental improvement measures, donations to organizations |
0 |
20 |
| Environmental remediation cost |
Pollution burden duties, etc. |
0 |
1 |
| Domestic Group total |
|
4,156 |
9,546 |
| YoY |
1,763 |
-284 |
Economic Benefit Associated with Environmental Conservation Measures
(Millions of yen)
| Effects |
YoY reduction |
| Cost reduction due to energy saving |
277.1 |
| Cost reduction due to resource saving |
183.0 |
| Reduced water utility cost |
-26.6 |
| Waste disposal reduction* |
44.9 |
*
Includes cost of sales of valuable waste
Environmental Efficiency
Every year, Lion calculates its environmental efficiency using the formula below to evaluate how efficient its business activities are in terms of the environmental burden they create. We continually strive to improve environmental efficiency.
*
Environmental impact (harm) is calculated as a monetary amount using the Life-cycle Impact assessment Method based on Endpoint modeling (LIME).
Environmental Efficiency and Monetary Value of Environmental Burden (comparison with 2005)
| |
Unit |
2020 |
2021 |
2022 |
2023 |
2024 |
| Monetary value of environmental burden (comparison with 2005) |
% |
84 |
84 |
90 |
78 |
87 |
| Environmental efficiency |
|
340 |
344 |
326 |
373 |
330 |
Production Site Environmental Data